

Arttu Lindeman
166.8K followers
@arttulindeman's other accounts

Arttu Lindeman
@arttulindeman•173.6K

ArttuLindemanVEVO
@arttulindemanvevo•36.2K
Find authentic influencers and run campaigns
223.1M+ influencer accounts
Precise filters & Al search
35+ key metrics in reports
Creator and content management
10 FREE basic influencer reports for new users
Engagement Rate
2.55%
Followers
166.8K
Avg. Likes
2.1K
Avg. Comments
15
@arttulindeman
Arttu Lindeman (@arttulindeman) Instagram Analysis, Net Worth & Earnings
@arttulindeman’s content relates to the following categories:
Singer
Entertainment
Music
Headphones
Music Tour
Dance
Global rank: 285,454 worldwide
Based on overall account performance and audience quality worldwide
Country rank: 168 in Finland
Based on overall account performance and audience quality in Finland
Category rank: 23 in Music (Finland)
Based on overall account performance and audience quality in Music in Finland
@arttulindeman’s Instagram Engagement Rate Analytics
2.55%
See how much audiences are engaged by a creator’s content. In April, @arttulindeman’s engagement rate was 2.55%. Compared to similar accounts, this score is "Average". For further Instagram engagement rate insights, such as authentic engagement and average engagement figures, unlock @arttulindeman’s full report.Average
LowExcellent
Engagement (Auth.)
Engagement (Avg.)
@arttulindeman’s Follower Growth Rate
0.00%
In April, @arttulindeman achieved a follower growth figure of 0.00%. This is considered "Low" compared to the average value for similar accounts. Their current Instagram follower count is 166,774. To see up to 12 months of historical data, register and unlock @arttulindeman’s full report.Low
Audience Quality Score Check
AI-powered
What we’ve checked:
Location
Quality of active audience
Likes & comments activity
Signs of comment pods
Account type
Audience demographics
Engagement rate breakdown
Signs of mass following
Signs of giveaways
Sentiment analysis
Check any influencer
@arttulindeman’s Following Trend
1.3K
Get a clear picture of an account’s following dynamics. Over the last 30 days, @arttulindeman has followed an additional 0 accounts, putting their current following count at 1,263. Their follower-to-following ratio is 132.05.Follower-to-Following Ratio
132.05
@arttulindeman’s Total Posts
214
See how many pieces of content an account has created. To date, @arttulindeman has posted a total of 214 times.@arttulindeman’s Average likes
2.1K
View the like dynamics for @arttulindeman’s content. To date, @arttulindeman has received an average of 2,089 likes on their content. Their likes-to-followers ratio is 1.25%. To see additional Instagram analytics such as likes views spread and average views per post, unlock @arttulindeman’s full report.Likes-to-Followers Ratio
1.25%
Likes views spread
Avg. views
@arttulindeman’s Likes-Comments Ratio
139.27
See how authentic the interactions with @arttulindeman’s content are. @arttulindeman’s likes-comments ratio is 139.27. This ratio is "Good" compared to similar accounts. They also achieved an average of 15 comments. Unlock @arttulindeman’s full report for further data such as comments average per post.Good

Avg. comments
15
Comment Rate
Sign up for free
Access advanced Instagram report insights such as fake followers and collaboration pricing for any account
Find authentic influencers and run campaigns
223.1M+ influencer accounts
Precise filters & Al search
35+ key metrics in reports
Creator and content management
10 FREE basic influencer reports for new users
@arttulindeman’s Historical Data
@arttulindeman’s follower count shifted from 166,774 to 166,774 from 11 Mar'26 to 11 Mar'26, yielding a growth rate of 0% for this period. Total posts went from 214 to 214, with the current like-to-comment ratio becoming 139.27. Unlock the full report for more detailed insights and historical trends.
| Date | Follower Count | Follower Growth | Following | Total Posts | Likes-comments |
|---|
12 Mar'26 | N/A | N/A | N/A | N/A | 88.50 |
11 Mar'26 | 166,774 -49 | -0.03% | 1,263 -266 | 214 +8 | 88.50 -12.62 |
09 Mar'26 | N/A | N/A | N/A | N/A | 101.12 |
07 Mar'26 | N/A | N/A | N/A | N/A | 101.12 101.12 |
Instagram Account Stats in Advanced Report
Explore @arttulindeman’s comprehensive Instagram influencer analytics with our Advanced Report, including complete Instagram audience analytics, and Instagram post analytics like cumulative likes, likes views spread, hashtag analytics, and 20 other crucial Instagram stats.
Audience interests
Audience quality & authenticity
Advertising performance
Lookalike influencers
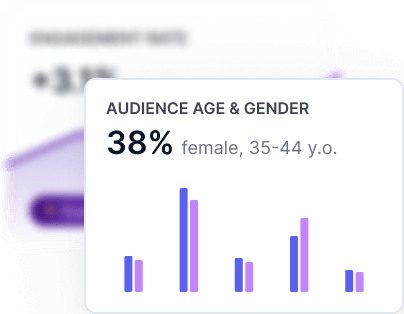
Audience age & gender
Hashtag analysis
Content analysis
…and 20 more metrics
@arttulindeman’s Monthly Income on Instagram
$3.3K – 4.6K
See how much money this creator earned on Instagram. In March 2026, @arttulindeman’s income estimates ranged from $3,340 to $4,576. If their monthly income remains at this level, their projected yearly earnings will range from $40,078 to $54,907.Yearly earnings
$40.1K – 54.9K
DISCLAIMER
@arttulindeman’s Earnings Chart on Instagram
View earnings trends over time for @arttulindeman. From April 2024 to March 2026, @arttulindeman’s income estimates ranged from $3,186 to $3,958. @arttulindeman’s earnings are currently on an upward trend.
DISCLAIMER
@arttulindeman’s Net Worth and Earnings Historical Data on Instagram
See historical earnings data for the creator on Instagram. In March 2026, @arttulindeman’s estimated earnings ranged from $3,340 to $4,576, higher than the figure in April 2024. While these earnings contribute to their overall financial success, their estimated net worth may also depend on other revenue streams.
| Month | Min. earnings | Max. earnings | Avg. earnings | Daily avg. | MoM change |
|---|
| March 2026 | $3,340 | $4,576 | $3,957.68 | $127.67 | 2.42% |
| February 2026 | $3,261 | $4,467 | $3,864.17 | $138.01 | N/A |
| January 2026 | N/A | N/A | N/A | N/A | N/A |
| December 2025 | $2,768 | $3,792 | $3,279.94 | $105.8 | 3.55% |
| November 2025 | $2,673 | $3,662 | $3,167.52 | $105.58 | 14.43% |
| October 2025 | $2,336 | $3,200 | $2,768.04 | $89.29 | -23.04% |
| September 2025 | $3,035 | $4,158 | $3,596.52 | $119.88 | 0.12% |
| August 2025 | $3,031 | $4,153 | $3,592.06 | $115.87 | 30.37% |
| July 2025 | $2,325 | $3,185 | $2,755.23 | $88.88 | 5.47% |
| June 2025 | $2,205 | $3,020 | $2,612.4 | $87.08 | 6.02% |
| May 2025 | $2,079 | $2,849 | $2,463.99 | $79.48 | -8.92% |
| April 2025 | $2,283 | $3,128 | $2,705.27 | $90.18 | -2.75% |
| March 2025 | $2,347 | $3,216 | $2,781.67 | $89.73 | -15.24% |
| February 2025 | $2,770 | $3,794 | $3,281.89 | $117.21 | -1.45% |
| January 2025 | $2,810 | $3,850 | $3,330.05 | $107.42 | 0.24% |
| December 2024 | $2,803 | $3,841 | $3,321.99 | $107.16 | 6.03% |
| November 2024 | $2,644 | $3,622 | $3,133.04 | $104.43 | 1.17% |
| October 2024 | $2,613 | $3,580 | $3,096.93 | $99.9 | -0.97% |
| September 2024 | $2,639 | $3,615 | $3,127.24 | $104.24 | N/A |
| August 2024 | N/A | N/A | N/A | N/A | N/A |
| July 2024 | $2,595 | $3,555 | $3,074.77 | $99.19 | 2.33% |
| June 2024 | $2,536 | $3,474 | $3,004.79 | $100.16 | 1.13% |
| May 2024 | $2,507 | $3,435 | $2,971.24 | $95.85 | -6.73% |
| April 2024 | $2,688 | $3,683 | $3,185.54 | $106.18 | N/A |
DISCLAIMER
Want to know how much working with an influencer costs?
Check out our earnings calculator to get estimated pricing for Instagram creators